

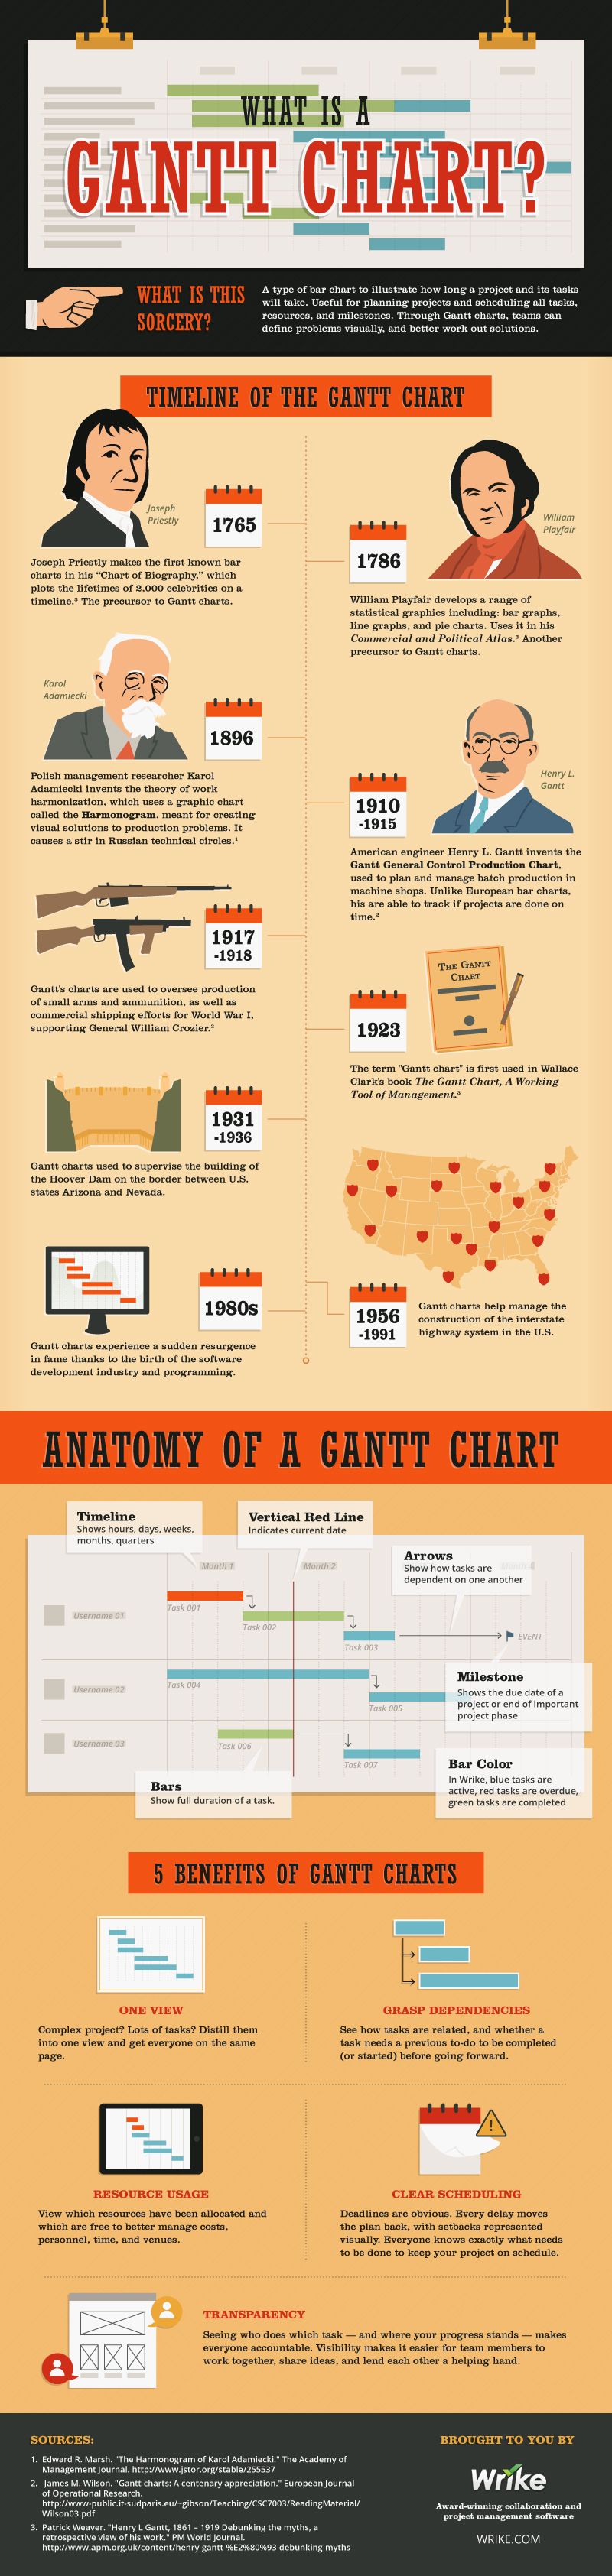
A Gantt Chart is a great way to help visualise your project planning. They let project teams see what tasks need to be completed before another task can start.
For those of you fresh to the world and methodology of project management, our partners at Wrike have come up with a great infographic explaining what a Gantt Chart is.
Candoer Pte Ltd helps businesses with their marketing, productivity, compliance and cost savings strategies.
We also work closely with our partners at Wrike to implement collaboration solutions suitable for your needs.
For further enquiries, please email us at:
jiekai.candoer@gmail.com or weekiang.candoer@gmail.com
